
Recently, as part of a selection task for a project, I had the chance to develop a high-fidelity UI design for a dashboard panel, expanding on an existing UX wireframe.
The UX provided was already pretty advanced so, even though it was an open brief, I took the wireframe as the blueprint, assuming it reflected some UX research that had already been done. So my reasoning was “no need to reinvent the wheel.”
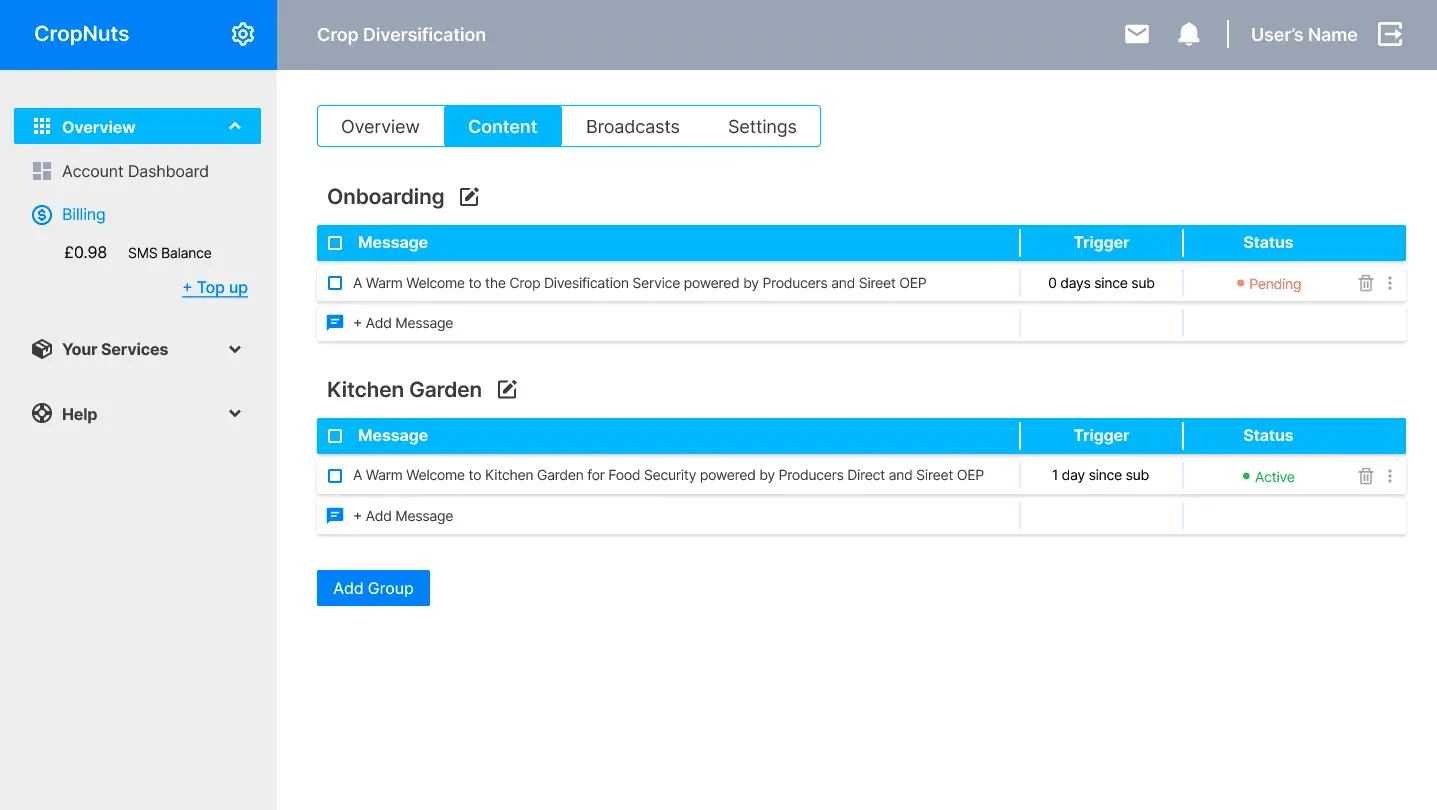
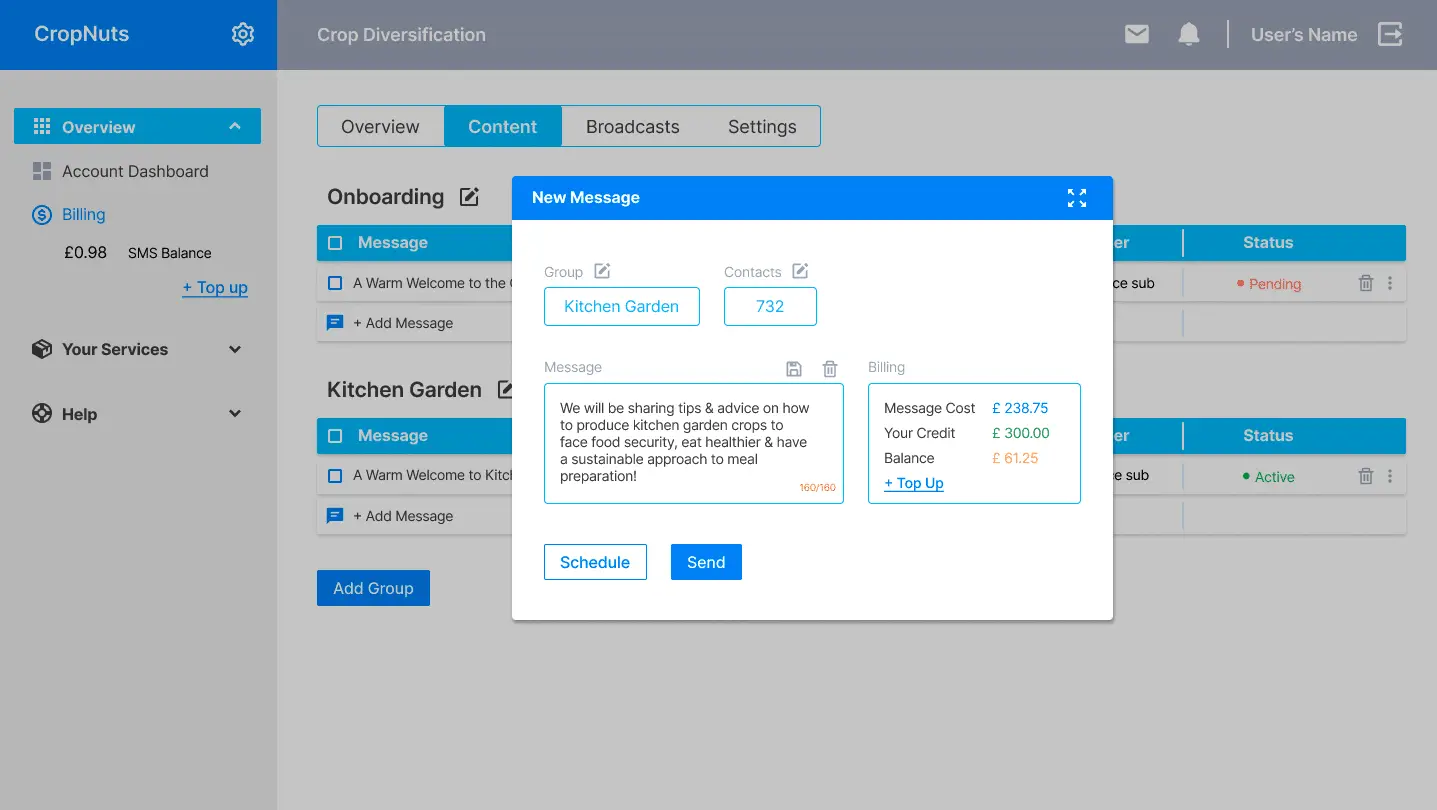
My approach was to make something clean and organized, as this was intended to be a “service” platform. The users would access it to create/achieve a task (send a message, create new groups, register new services) or to verify information (check their dashboard with some stats, check/top up their credit, view some reports). So in my view, it shouldn’t be distracting and should go straight to the point while being visually pleasing.
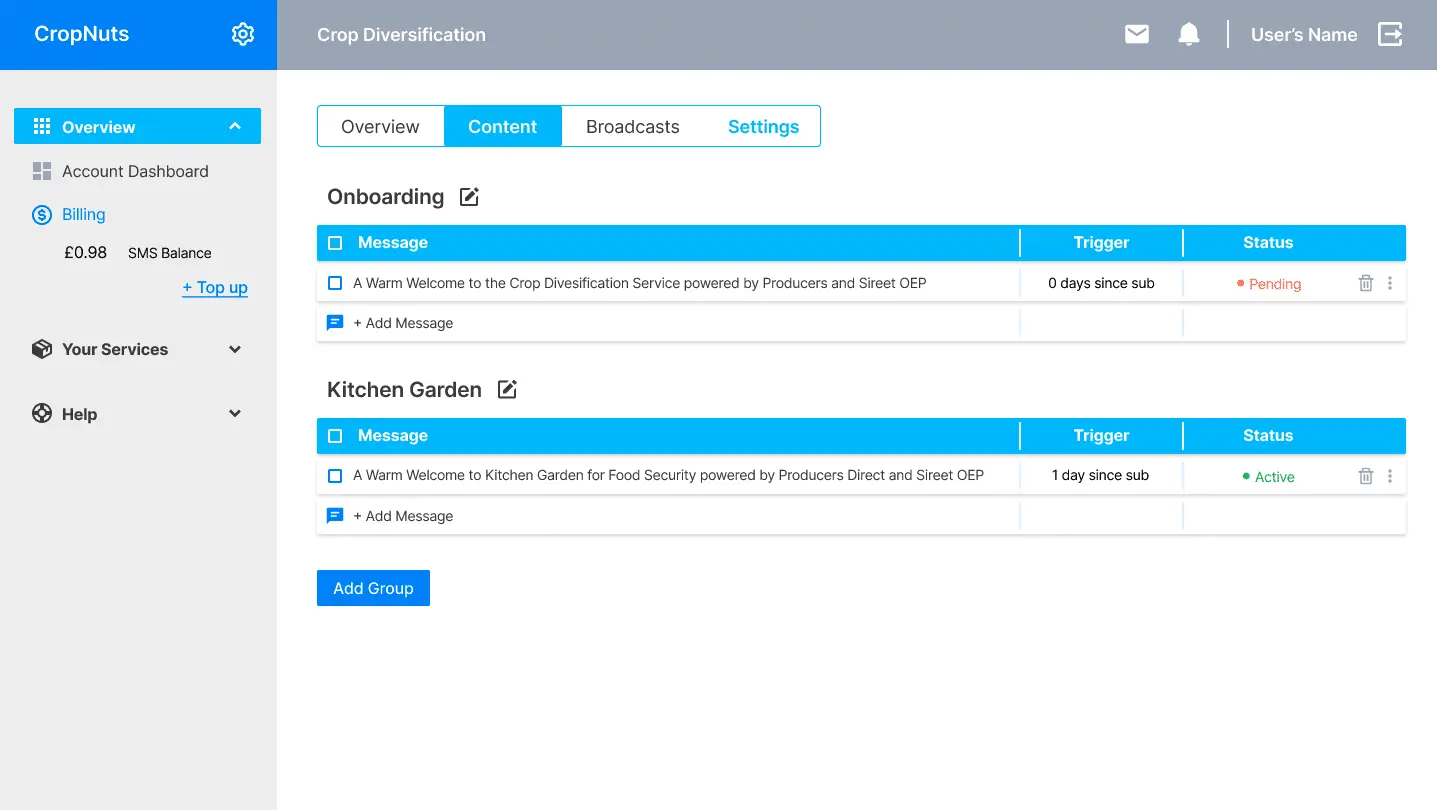
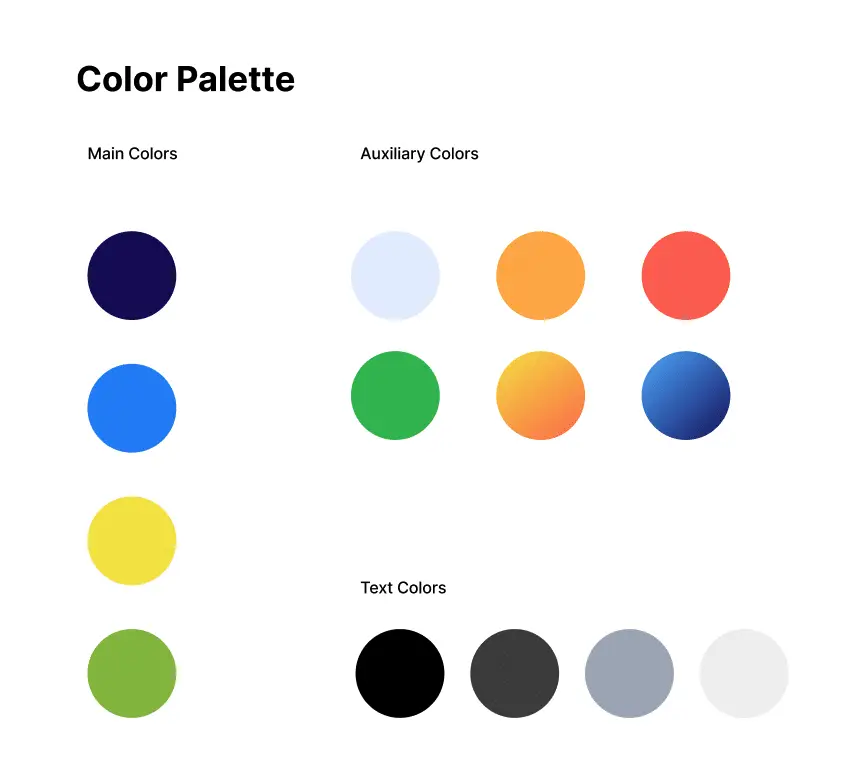
For the color palette, I looked for inspiration on agricultural tones (blues, greens, and darker yellow, with gray as an auxiliary color). In the end, I decided to go with shades of blue for these screens, to reflect and relate to the client’s main color. (One possibility I would explore would be to have different colors for each section, either for the top bar (Overview/Broadcasts/Settings) or for the side menu sections).
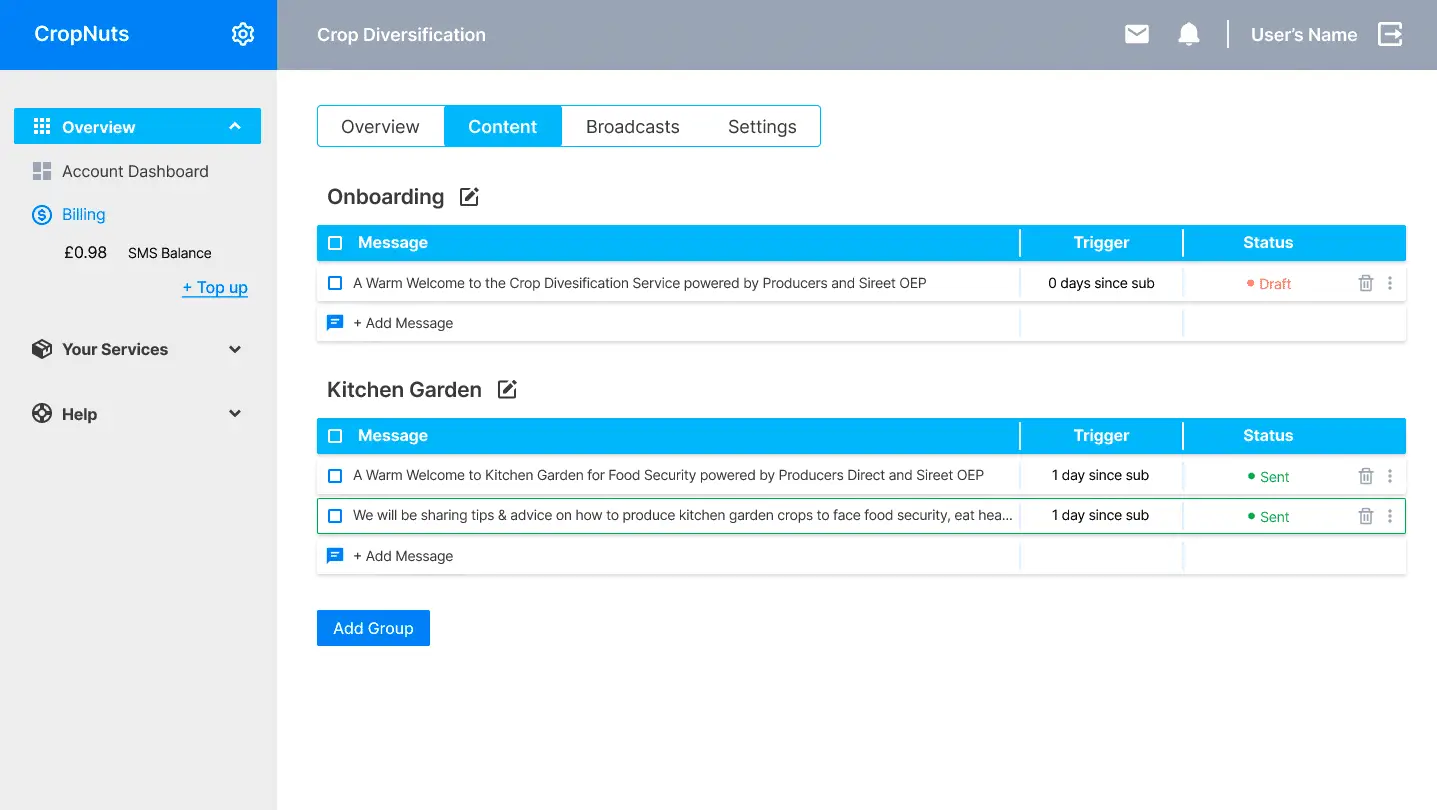
I also brought several icons to the design to help organize and differentiate some sections of the screen, such as the menu options and possible actions in the messages table.
To illustrate the transitions and interactions, I did some animations on the side menu sections, the tab bar on the main screen, and the button. I also simulated the transition to writing a new message.
In the end, this was a fun task to take part in, taking me about one afternoon to accomplish. I also took the opportunity to further enhance my Figma skills, learning more about interactions and animations, developing an icon component library, and playing around with variants and prototyping.
To see the interactive prototype, click here.